Dota 2 Drafting Part 2: Hero Pairings
The data collected from Valve’s API contains a plethora of information about relationships between heroes, teams, and winrates. This data lends itself to the construction of graphs depicting the relationships. This has a twofold purpose:
- To assess the integrity of the collected data. If the graphs that come out don’t line up with the common strategic thinking about the heroes then additional stratification is necessary (most likely by game skill bracket).
- To explore the data set to see what hero combinations are popular along with showing which combinations work well and which don’t.
Data Processing
Since the record for each match contains information as to which team won, and what the picks were, it’s just a matter of another MapReduce job to pull out the relationships between heroes, picks, and win rates. In particular, each game record gives us 5 heroes that won together, and 5 heroes that lost together. Thus our mapper step looks like this (after we get the picks by team):
radiantcliq = list(itertools.combinations(radiantpicks, 2))
direcliq = list(itertools.combinations(direpicks, 2))
# one can edit the combinations argument to pull out arbitrary n-cliques

for c in radiantcliq:
	print '%s,%s:%s\t%s' % (c[0], c[1], int(team_win == 'True'), 1)
for c in direcliq:
	print '%s,%s:%s\t%s' % (c[0], c[1], int(team_win == 'False'), 1)
The result of the MapReduce step is essentially a list of edges and weights. Python has the networkx library which allows us to create the graph structure without much fuss; even better, it supports JSON output which allows us to use D3.js to render the graphs and play around with them.
The Graphs
Winrates necessitate special treatment. Each hero, indexed as \(i\), has their own, winrate (indexed over all heroes):
\[\dfrac{W_i}{N_i} = \dfrac{\displaystyle\sum_j w_{ij}}{\displaystyle\sum_j n_{ij}}\]
For a hero pair \((i, j)\) the hero pair popularity is \(n_{ij}\) and the hero pair winrate is \(\frac{w_{ij}}{n_{ij}}\). However, this hero pair winrate does not have an obvious relationship with the “absolute” winrates for the heroes, \(\frac{W_i}{N_i}\) and \(\frac{W_j}{N_j}\). The pair winrate alone is not very informative; what would be informative is a determination of how much better the pair is. The simplest (although coarsest) measure is the difference between the pair winrate and the maximum of the individual winrates:
\[r_{ij} = \dfrac{w_{ij}}{n_{ij}} - \max\left(\dfrac{W_i}{N_i}, \dfrac{W_j}{N_j}\right)\]
This is a measure of the “improvement” the pair has to working individually.
Graph Topology
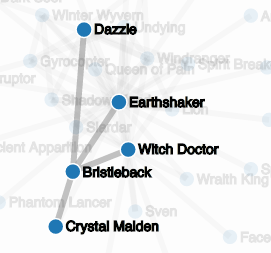
By selecting a threshold parameter and removing edges if their weights fall below the threshold, the graphs for winrates and popularity can be endowed with more interesting topology. Both of the graphs could have a quite different topology depending on the skill level of the population being drawn from. Additionally, different measures of popularity and winrate can easily give rise to different topologies depending on what is being measured. For example, a similar procedure to the winrate improvement measure could be employed on popularity to filter out the existing effect of a hero being popular; it is no surprise that Earthshaker is at the apparent center of the popularity graph since (as we saw in the previous post) he is far and away the most picked hero by himself in the data set.
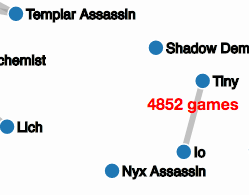
Ideally, we would prefer measures that give us graph topologies that give rise to many disjoint parts with as few isolated nodes as possible. These disjoint parts would line up with distinct strategies or combinations; for example, the Tiny-Io combination shows up as a disjoint element in the popularity graph already for any threshold below 4800.
Further Plans
The analysis up to now has assumed that heroes perform equally well on radiant and dire side- not necessarily true. Additionally, it has made no distinction in skill groups; all of the analysis has been done on the total data from all the public matches.
Alternative graphs and measures could be used to determine more information. One relationship that may be worth exploring is a “counter-pick” graph that tracks how many times two heroes faced off against each other on separate teams. Another graph worth looking into could be the “anti-pair” graph working to distinguish which heroes fulfill a similar role: if we count up how many times a hero is not picked when another hero is picked. However, there will be a significant amount of noise since any particular game only allows for 5 picks, leaving 95% of the hero pool unpicked as a matter of course.